
Project Tracker – Project reporting made easy
We have used our experience of the challenges facing project teams in tracking project progress, and have developed a simple-to-use S-Curve generation application – Project Tracker. Project Tracker is a Windows-based application that imports project information from Primavera P6, Microsoft Project and Asta Powerproject to create S-Curves which are used to analyze the progress of the project.
KEY BENEFITS OF USING PROJECT TRACKER
1. Import project and baselines from P6, MSP or Asta
2. No need to have P6 installed on PC
3. Create S-Curves without adding resources or costs
4. Create S-Curves without exporting to MS Excel
5. View the Gantt Chart under the S-Curve
6. Fully configurable and easy to use and learn
7. Filter by WBS, Activity code and/or Resource
8. Batch print for multiple one-click reports
9. Text-based progress report included
10. Fully customisable data table

EASILY CREATE S CURVES FROM YOUR FAVOURITE PLANNING SOFTWARE
An S-Curve is a graphical representation of cumulative costs, man hours or time measured against the overall project plan. It is an ideal tool for managers to quickly assess where the project stands in terms of completion, deadlines, and budget. Additionally many clients will ask for an S-Curve report as part of the regular progress update.
PAYS FOR ITSELF AFTER ONE PROGRESS CYCLE…
Traditional methods of exporting data to a spreadsheet require a number of steps and a certain level of knowledge including how to add resources or costs to the plan, how to create time phased exports from the PM tool, how to open the data in the spreadsheet and how to create graphs from the data. Project Tracker eliminates all of these steps. Aside from the number of steps required to export data from PM software to a spreadsheet, this method can be acceptable as a reporting medium, but the problem is that the analytical possibilities are not available as the data is now disconnected from the actual plan. Therefore, rather than just importing the data required to plot a curve, Project Tracker imports the activity data and is able to optionally plot a Gantt Chart under the S-Curve, allowing the project manager to assess which activities may be causing issues and what action can be taken. Once data has been imported, Project Tracker allows graphs to be created for a portfolio of projects, individual projects, WBS hierarchy and Activity Code. Additionally filter by resource for man hour and material curves.
MORE FEATURES OF PROJECT TRACKER
-
Import projects and baselines from Primavera P6, Microsoft Project and Asta Powerproject
-
Easy creation of Earned Value and S Curves
-
Create S-Curves without having to export to Excel
-
View your Gantt chart under S-Curve
-
Filter by Portfolio, Project and WBS
-
Filter by Resource and Activity code
-
Batch print for multiple one click reports
-
Text based progress report included
-
Add text to curves
-
Create and save views of filtered curves
-
Dynamic feedback of progress status at any point
-
Create forecast lines based on current progress rate
-
Create recovery program lines
-
Activity properties pane to view activities
-
Save data to xml to share with other users
-
Logo and version control on printouts
Key features of Project Tracker
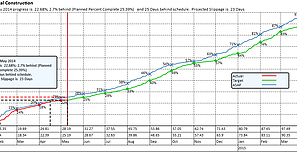
S Curves based on duration, cost or resource
The simplest and clearest way of seeing how a project is progressing
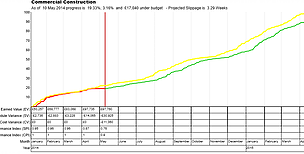
Earned Value analysis
Full reporting on the Earned Value of your project including trend lines for SI and CPI
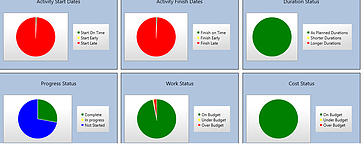
Dashboard Reports
Graphical at a glance dashboards to help you assess progress
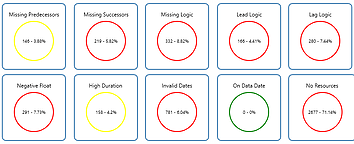
Project Quality Reports
14 key indicators as to the quality of your project
Downloadable White Papers:
User Reviews:
“I typically use Project Tracker to produce various curves using the code and WBS filters to analyze project schedules prior to submitting them to clients as a part of my QC check. Project Tracker makes this easy and allows me to check against baselines or previous updates and quickly look at cost, resource or duration curves to drill down to variances.”
– Paul Epperson, ConSchManServices, USA
“Our team at Jam Solutions have a requirement to report accurate earned value S Curve’s to our clients. We needed a tool the we could dig into, to get specific data and Project Tracker fitted the bill. We are working on very high profile projects in New Zealand and it was important to not only have the right tool but have the right support, and Willmer have been quick and efficient in helping us get the best out of the tool.”
– Dave Smith, Jam Solutions, New Zealand

REQUEST A QUOTATION
-
ProjectPro provides best-in-line local support and services (implementation and consultancy).
-
ProjectPro offers formal software training and free hands-on workshops.